
Microsoft Excel remains the most widely used tool for business calculations, budget tracking, and ad-hoc reporting. However, as business data grows rapidly, managing complex spreadsheet workbooks causes version control issues, file crashing, and manual entry errors.
Therefore, transitioning to automated cloud reporting is essential for scaling modern business analytics. This detailed tutorial breaks down migrating from Excel to Power BI through a practical, step-by-step workflow.
Why Modern Businesses Migrate Away from Spreadsheets
Static spreadsheets struggle to support real-time enterprise decision-making.
First, standard Excel files slow down significantly when processing hundreds of thousands of transactional rows.
Second, emailing static workbooks creates multiple conflicting report versions across internal departments.
Step 1: Cleaning and Structuring Raw Excel Files
Successful migration begins by preparing raw spreadsheet data before importing it into business intelligence engines.
Remove merged header cells, decorative empty rows, and manual subtotal lines from your worksheets.
Furthermore, ensure every dataset column contains a unique header name and consistent data types across all rows.
Step 2: Importing Excel Data into Power Query
After organizing your spreadsheets, launch Power BI Desktop and select the Excel workbook connector.
Open the Power Query Editor to transform messy text records into clean relational data tables.
Consequently, steps like unpivoting attribute columns, filtering empty values, and changing text types run automatically upon every future report refresh.
Master Enterprise Analytics and Migration Strategy
Transitioning business workflows requires hands-on experience in data transformation, schema modeling, and cloud distribution.
Many professionals enroll in structured training environments to master modern reporting platforms quickly. Completing accredited power bi training in hyderabad provides practical experience in converting complex Excel workbooks into automated cloud dashboards.
Additionally, taking a comprehensive power bi course hyderabad teaches analysts how to translate traditional Excel formulas into high-performance DAX measures effortlessly.
Step 3: Translating Excel Formulas to DAX Measures
Replacing spreadsheet cell formulas with dynamic Data Analysis Expressions (DAX) ensures scalable calculations.
Instead of writing cell-based formulas like =SUM(A1:A50), write dynamic measures using SUM(), AVERAGE(), or CALCULATE().
Because DAX evaluates calculations dynamically based on report slicer filters, your measures update instantly across interactive visual charts.
Step 4: Building Interactive Dashboards and Publishing
After defining custom DAX measures, design intuitive visual layouts on the reporting canvas.
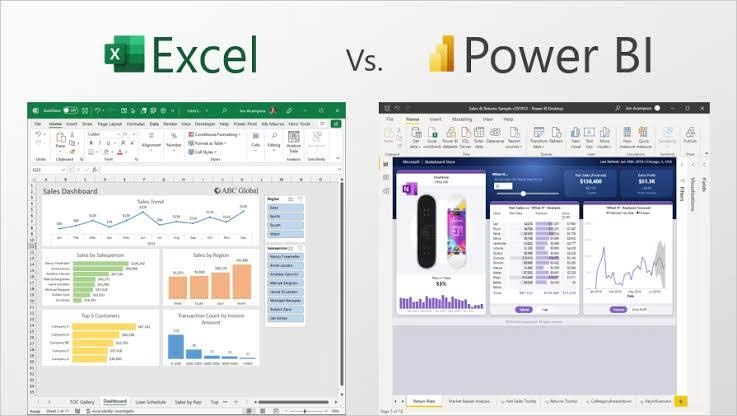
Replace static Excel charts with interactive bar graphs, trend lines, matrix cards, and slicers.
Finally, publish your completed report to the Power BI Service and configure scheduled cloud refreshes to eliminate manual data entry completely.
Advancing Your Analytics Career in Tech
As companies replace manual spreadsheet tasks with automated reporting, analysts who lead BI migrations command high industry demand.
If you want to accelerate your career transition, joining dedicated power bi training hyderabad offers direct mentorship from experienced data solution architects.
Selecting the best power bi training hyderabad ensures you master both backend database integration and frontend visual storytelling. Learning at a reputable power bi institute hyderabad provides the hands-on project portfolio needed to secure competitive analytics roles.
Final Thoughts
Following this guide for migrating from Excel to Power BI upgrades tedious manual updates into scalable cloud automation. By cleaning raw tables, mastering DAX calculations, and publishing automated dashboards, you save valuable time while delivering reliable business insights.