
The Big Math Myth in Tech
Many people want to switch into a data analytics career but stop because of one big fear: advanced mathematics. They think they need to be a calculus genius or an algebra expert to work with corporate datasets.
This major misconception keeps wonderful, logical thinkers out of the technology sector. In reality, entry-level data analysts do not spend their days solving complex textbook theorems or manual formulas.
Modern software applications handle almost all the heavy computations automatically. Your real job is to interpret what the results mean for your business. Enrolling in a practical data analyst course in hyderabad will teach you exactly how to apply basic logic to data systems without any stress. Let us look at the actual math you will use on the job.
The 3 Math Concepts You Actually Use
You can completely skip advanced academic geometry and calculus. Instead, focus all your attention on these three foundational concepts from everyday school arithmetic.
1. Descriptive Statistics (The Big Three)
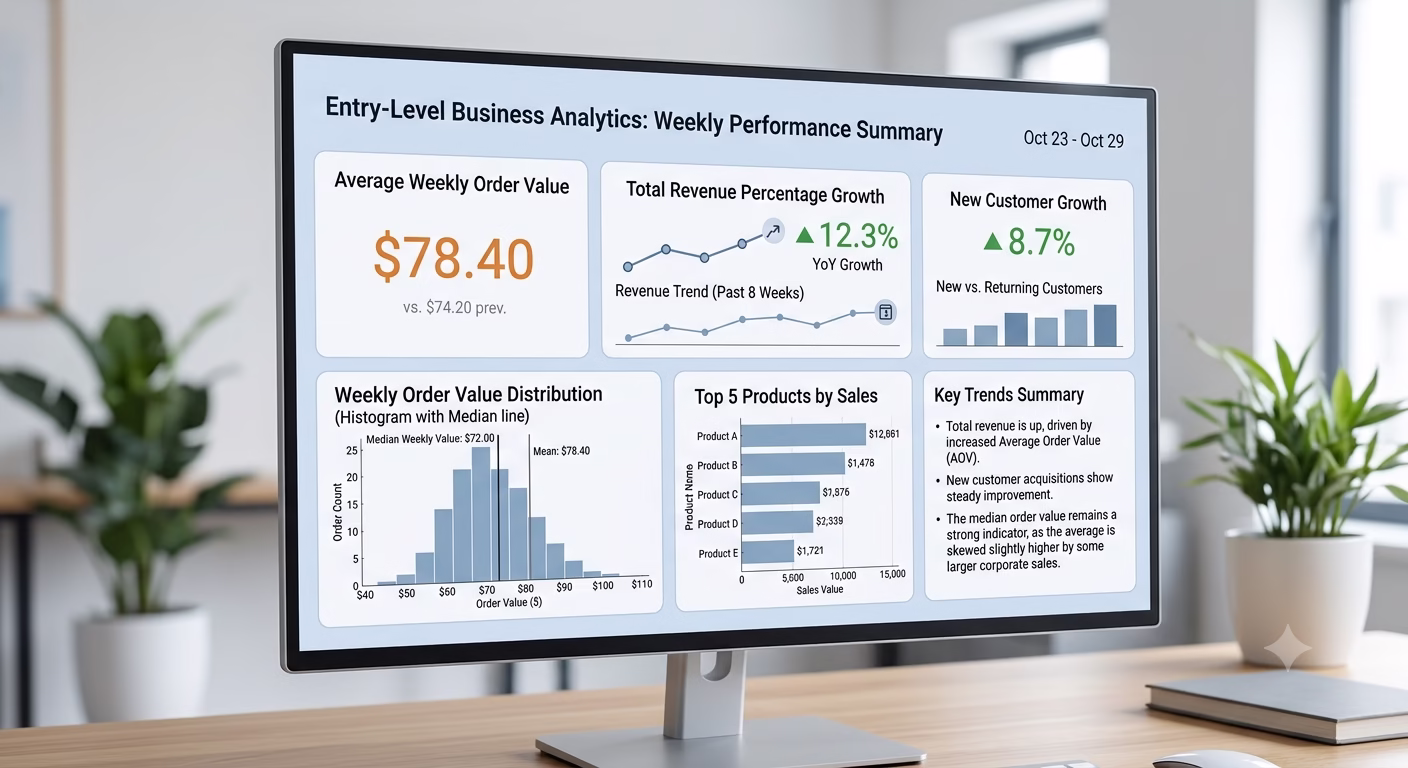
You must understand how to find the middle ground of a numbers list. This means mastering Mean (the average), Median (the absolute middle value), and Mode (the most common number).
-
Why it matters at work: If a retail brand asks you to analyze customer spending habits, you will use the median spend to remove extreme outliers and find the truest picture of a typical shopping trip.
2. Percentages and Relative Growth Rates
Business managers constantly think in terms of percentage movements. You need to know how to calculate basic margins, percentage increases, and total ratios.
-
Why it matters at work: You will write simple database queries to track performance changes, such as: “Did our marketing campaign increase our weekly user sign-up rate by more than 12%?”
3. Reading and Interpreting Distributions
You need to look at a chart and understand how data points are spread across a scale. This means recognizing whether most numbers bunch up at the beginning, middle, or end of a graph.
-
Why it matters at work: Understanding simple data distributions helps you spot anomalies, track normal delivery time frames, and identify your most profitable product ranges instantly.
Let the Software Do the Heavy Lifting
Remember, you do not need to calculate standard deviations or averages by hand with a pen and paper. Tools like Excel, SQL, and Power BI do all the counting for you in less than a second.
Your true value lies in your business intuition. Companies do not pay you to do basic math; they pay you to explain what those math results mean for the company’s future growth.
If you are ready to build practical technical skills using simple, approachable logic, find a hands-on training provider. Joining an industry-ready data analyst course in hyderabad offers you clear, step-by-step guidance to master analytics tools confidently, regardless of your past math grades.