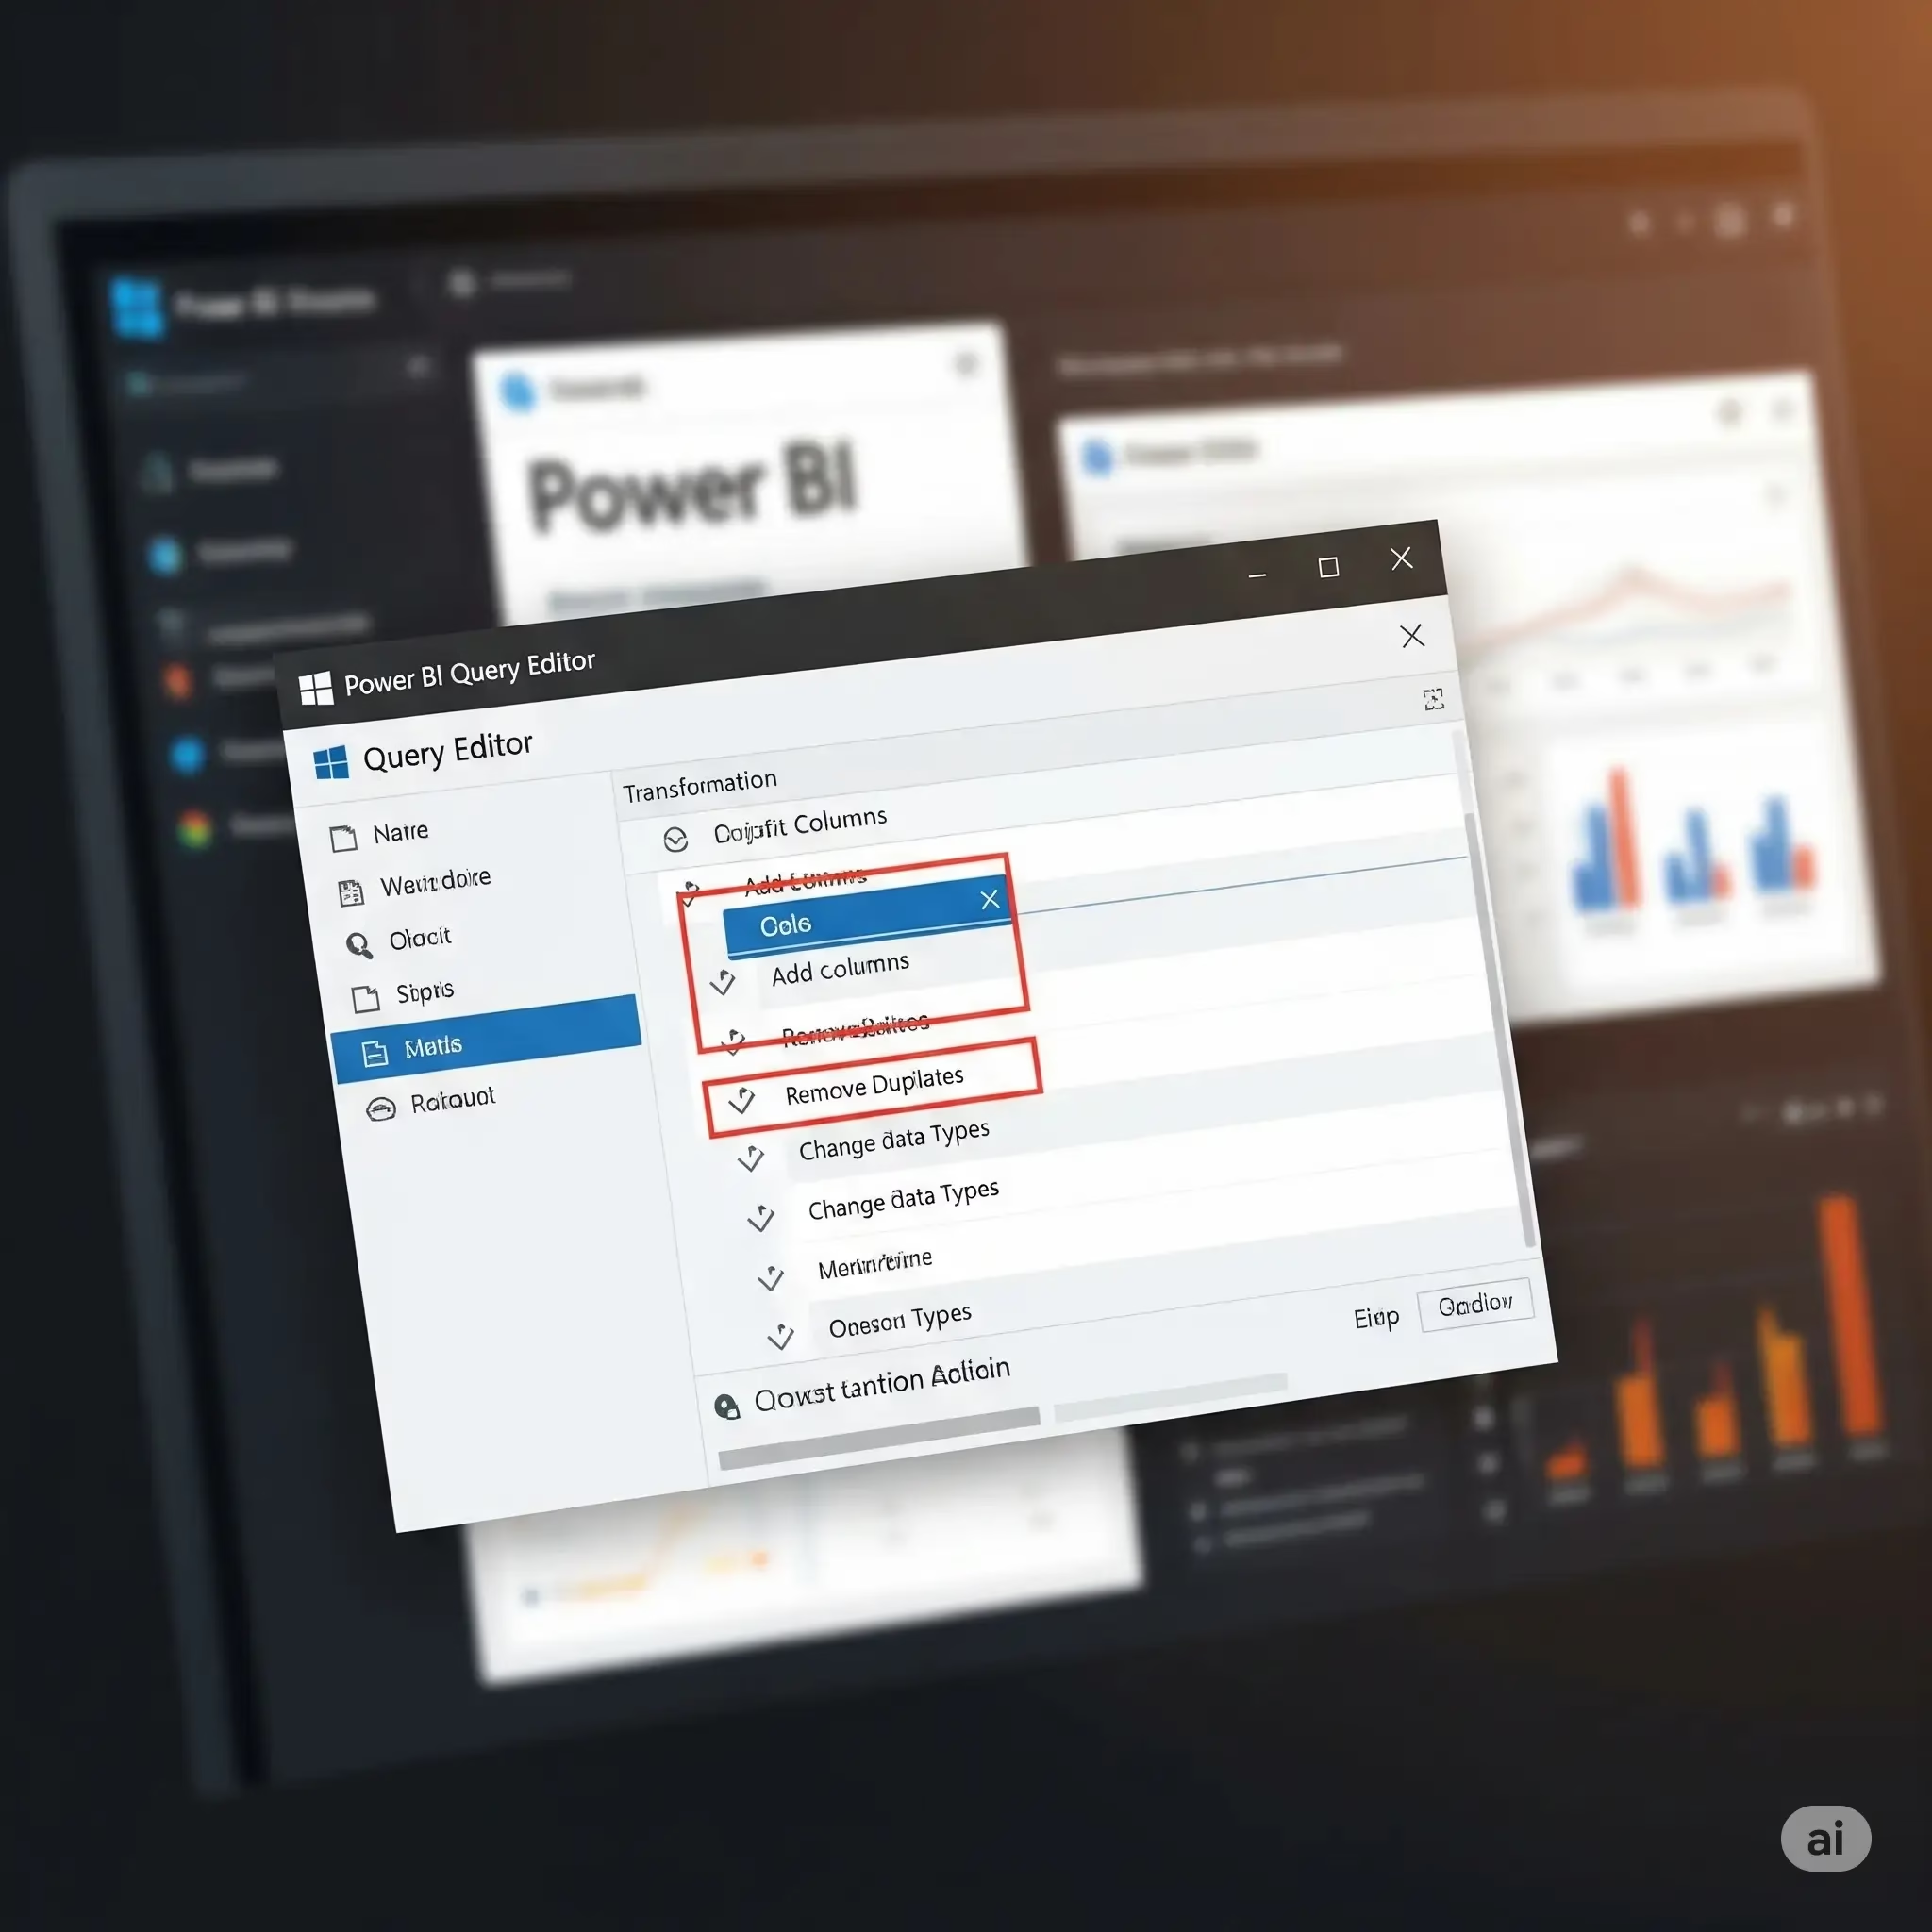
From working with Power BI Query Editor: Transform Your Data steps
Before you can create beautiful and insightful visualizations in Power BI, your data must first be prepared—and that’s where the Power BI Query Editor (also known as the Power Query Editor) comes in.
Power BI Query Editor—your data cleansing game changer Power BI Query Editor is an invaluable tool that enables you to connect, transform, and load data into Power BI Desktop even if you are not a professional data wrangler. In this post you will learn how to work with Power BI Query Editor and how to use it to transform your data by following step by step guidelines.
What is Power BI , Query Editor?
Power BI Query Editor is a data connectivity and transformation tool available in Power BI Desktop. It allows users to:
Under the hood, it’s using something called M (also known as Power Query Formula Language) but you never need to learn it—the menus are so intuitive that you can work 95% of the time without writing any code.
Exploring the Query Editor
To open the Query Editor:
In PBI Desktop, click on “Transform Data” in the home tab.
This opens a new window that allow you to work with queries to apply transformations, and preview your data changes.
Common Data Transformations (And Code Examples)
Here’s a step-by-step guide on converting your data in the Power BI Query Editor:
1. Remove Unnecessary Columns
Get rid of columns that you don’t need for less memory use and a cleaner data model.
Example: Right-click the column heading and then choose Remove.
2. Rename Columns for Clarity
Rename columns with readable, intuitive names wherever possible.
Example: Double-click on the column type and give it a friendly name — e.g., “Customer Name” instead of “Col1”.
3. Change Data Types
Make sure each column was assigned the right type of data (text, date, and number).
For instance, one-click on the small icon beside the column name, and select a type as Date or Decimal Number.
4. Filter Rows
Filter bad data on query time.
Example: Dropping rows that contain null data or dropping records that contain out of date information.
5. Split Columns
You can split a column on delimiters such as comma, space or custom character.
Example: Separate a “Full Name” column into columns “First Name” and “Last Name”.
6. Merge or Append Queries
Combine data from multiple tables:
Merge – Consolidates data from two tables by looking up matching key columns (similar to VLOOKUP).
Append: Adds rows from one table to another (similar to stacking two datasets).
7. Remove Duplicates
Get rid of the duplicated rows for data accuracy.
Example: Right-click the column and select Remove Duplicates.
8. Group Data
Group row-wise by a column and summarize by other columns.
Example – Group by region and sum sales.
9. Add Custom Columns
You can define new columns with custom formulas.
Example: Create a “Profit” column by subtracting costs from revenue.
10. Apply Conditional Columns
Build DAX-free, rules-based columns.
Example: If Revenue > 10000, then “High Performer,” else “Regular.”
Query Editor Pro Tips
View / edit the M code behind your queries of your transformations in the built-in “Advanced Editor” (Power Query)USE POWER BI DESKTOP (multiple connections can already be done through Excel) to get data from different sources / create a data model -Open the “Advanced Editor” to be able to view / edit the M code behind your transformations.
Each transformation is added as a step in the “Applied Steps” pane—so it’s easy to see the work you’ve done to your data (and you can undo or modify anything).
Learn how your queries are connected visually with Query Dependencies.
Why transform data before loading?
When you change data in Query Editor, the following applies:
The Problem with It:
Enlarges size of memory and file.
Delays refreshes and responsiveness of interaction.
Makes model maintenance difficult.
The Fix:
Delete columns and tables that are not in use.
Filter and query at the source using query extending and query execution.
When data is only required as aggregates then use summary tables.
Conclusion
The Power BI Query Editor is the holy grail of the data transform and data shaping process. When using useful descriptions and information, your data will be better transformed and have more useful insights in resulting reports.
With Power BI Query Editor, not only are you able to shape and model your data in any number of ways, you can also run any transformation you want with complete control of your table values.
Looking to gain experience in transforming data like a pro?
